Overview and What You Will Learn
In this guide you will learn exactly what resource requests and limits are, how the Kubernetes scheduler uses them, what happens when a pod exceeds its limits, and how QoS classes affect which pods get evicted first during node pressure. By the end you will be able to set correct resource values for any workload and understand why getting this wrong causes OOMKills and CPU throttling.
Why This Matters in Production
On a shared Kubernetes cluster at Zerodha or Razorpay, dozens of services run on the same nodes. Without resource limits, one poorly written service can consume all the memory on a node and cause every other pod on that node to be evicted. Without resource requests, the scheduler has no information to make good placement decisions and packs too many pods onto one node. Getting resource configuration right is the single most impactful thing you can do for cluster stability.
Core Principles
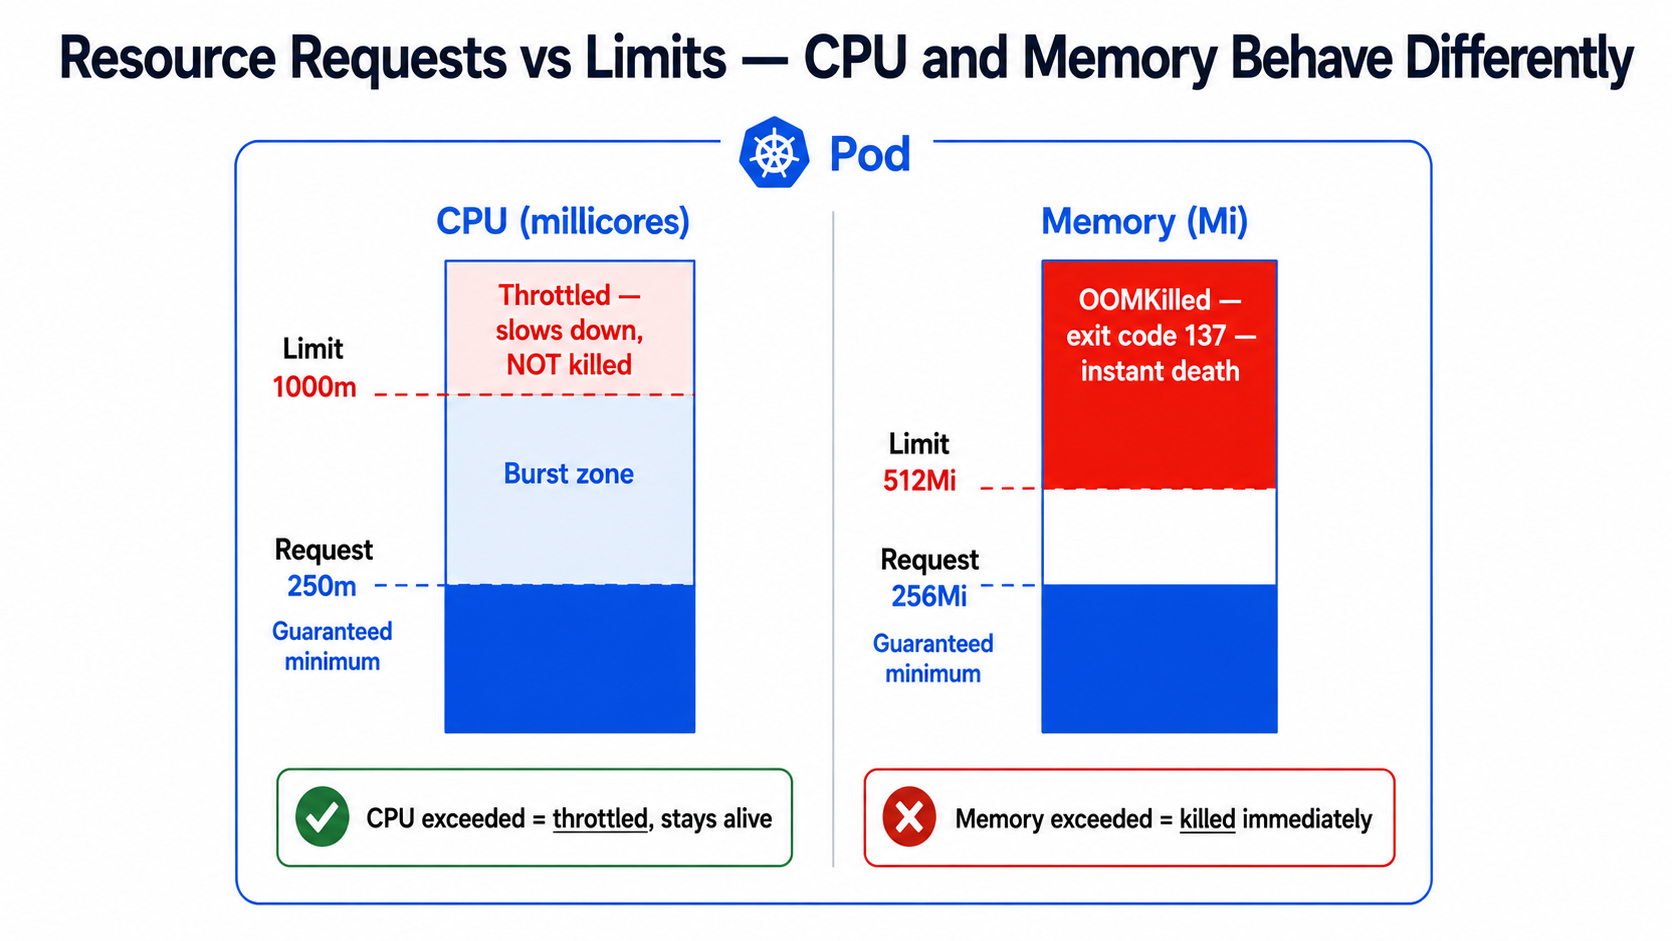
The most important rule to understand:
+------------------------+ +------------------------------+| Memory | | CPU || | | || Exceeds limit | <------> | Exceeds limit || -> Pod is KILLED | | -> Pod is THROTTLED || -> Exit code 137 | | -> Runs slower, not killed || -> OOMKilled status | | -> Hard to detect |+------------------------+ +------------------------------+Detailed Step-by-Step Practical Lab
Step 1: Setting Resource Requests and Limits Correctly
# deployment.yaml — correct resource configuration for a Node.js APIapiVersion: apps/v1kind: Deploymentmetadata: name: payment-api namespace: productionspec: replicas: 3 template: spec: containers: - name: payment-api image: registry.razorpay.in/payment-api:v3.1.0 resources: requests: cpu: "250m" # 250 millicores = 0.25 of one CPU core # The scheduler RESERVES this on the node memory: "256Mi" # 256 megabytes guaranteed on the node limits: cpu: "1000m" # 1 full CPU core maximum # If exceeded: throttled not killed memory: "512Mi" # 512 megabytes maximum # If exceeded: OOMKilled immediatelyUnderstanding CPU units:
+------------------------------------------+| 1000m = 1 CPU core = 1 vCPU |+------------------------------------------+| 500m = 0.5 CPU core |+------------------------------------------+| 250m = 0.25 CPU core (1/4 of a core) |+------------------------------------------+| 100m = 0.1 CPU core (minimum practical)|+------------------------------------------+Step 2: How to Find the Right Values
Never guess resource values. Always measure first:
# Step 1 — Deploy WITHOUT limits first in staging# Run for 24-48 hours under realistic traffic # Step 2 — Install metrics-server if not presentkubectl apply -f https://github.com/kubernetes-sigs/metrics-server/releases/latest/download/components.yaml # Step 3 — Observe actual CPU and memory usagekubectl top pods -n production# NAME CPU(cores) MEMORY(bytes)# payment-api-7d9f8b-xkp2q 180m 210Mi# payment-api-7d9f8b-ab1cd 220m 235Mi# payment-api-7d9f8b-zx9lp 195m 198Mi # Step 4 — Calculate good values# Peak CPU observed: 220m# Add 50% headroom for spikes: 220 * 1.5 = 330m# Set request to average: 200m# Set limit to peak + headroom: 330m -> round to 500m # Peak memory observed: 235Mi# Add 30% headroom: 235 * 1.3 = 305Mi -> round to 320Mi# Set request to average: 220Mi# Set limit to peak + headroom: 320Mi -> round to 384Mi or 512Mi # Step 5 — Watch for CPU throttling after limits are appliedkubectl exec -it payment-api-7d9f8b-xkp2q -n production -- \ cat /sys/fs/cgroup/cpu/cpu.stat | grep throttled# nr_throttled: 0 means no throttling (good)# nr_throttled: 150 means the CPU limit is too lowStep 3: Understanding QoS Classes
Kubernetes assigns every pod a Quality of Service class automatically based on its resource configuration. This class determines which pods get evicted first when a node runs out of memory.
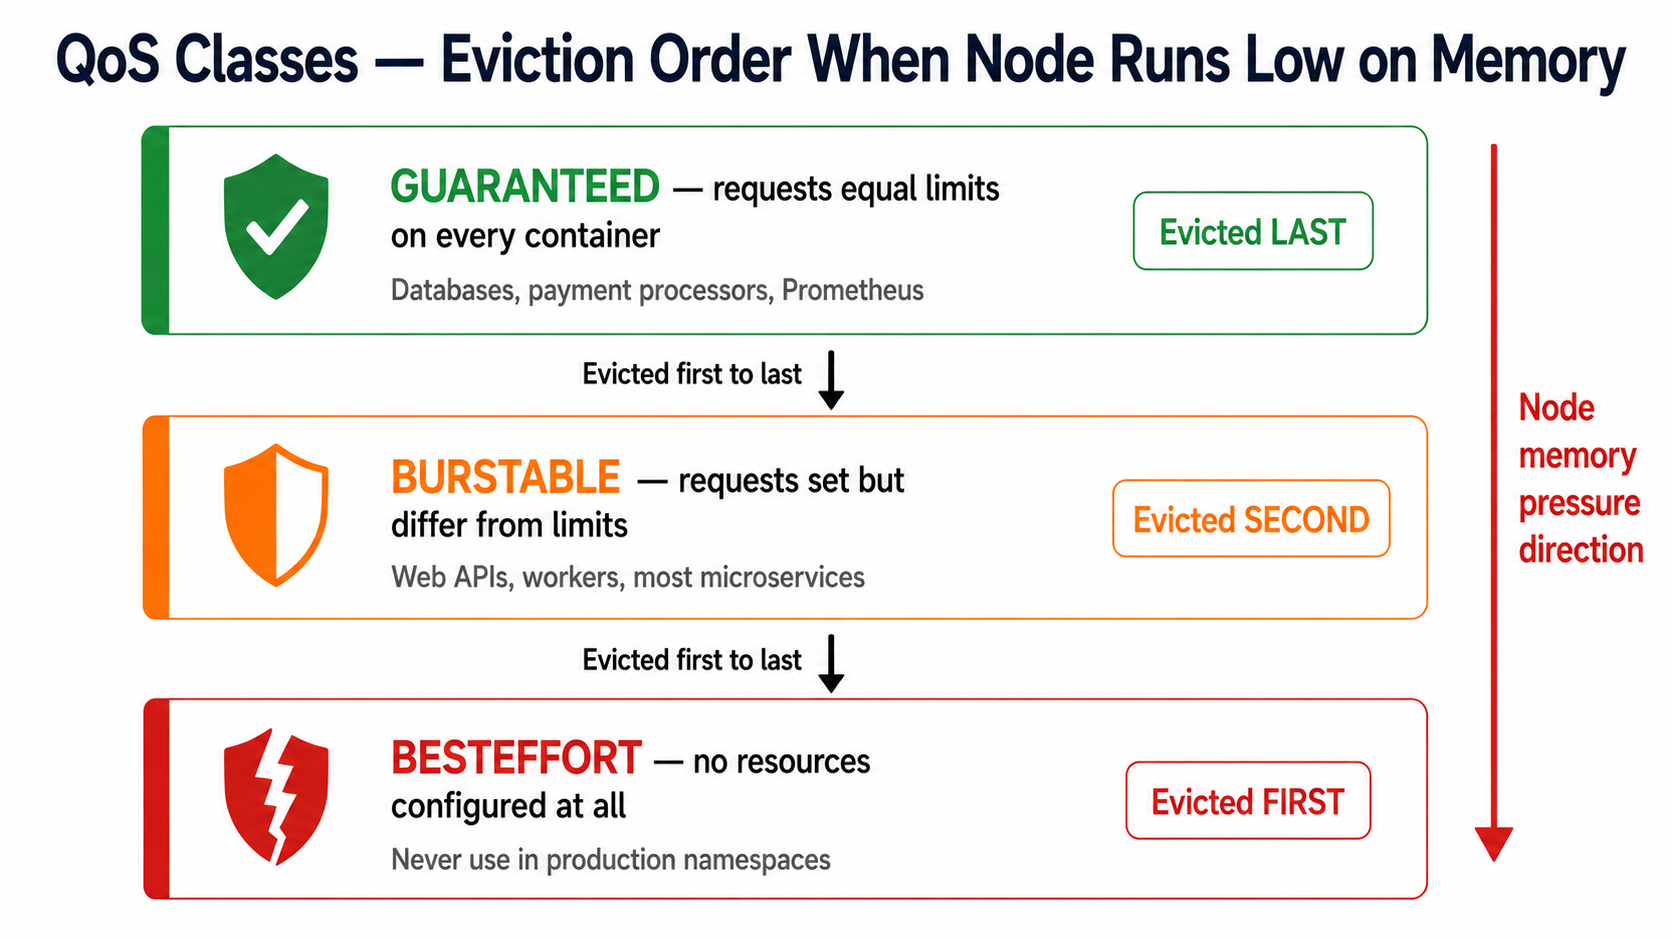
# Guaranteed QoS — for critical services like payment processors# requests MUST equal limits for EVERY containercontainers: - name: payment-core resources: requests: cpu: "500m" memory: "512Mi" limits: cpu: "500m" # Exactly equal to request memory: "512Mi" # Exactly equal to request# kubectl get pod <name> -o jsonpath='{.status.qosClass}'# Output: Guaranteed# Burstable QoS — for most application workloads# requests are lower than limits — pod can burst when node has headroomcontainers: - name: order-api resources: requests: cpu: "200m" memory: "256Mi" limits: cpu: "1000m" # Can burst up to 5x the request memory: "512Mi" # Can burst up to 2x the request# kubectl get pod <name> -o jsonpath='{.status.qosClass}'# Output: Burstable# Check the QoS class of any running podkubectl get pod payment-api-7d9f8b-xkp2q -n production \ -o jsonpath='{.status.qosClass}' # List QoS class for all pods in a namespacekubectl get pods -n production -o custom-columns=\NAME:.metadata.name,QOS:.status.qosClassStep 4: CPU Throttling — The Silent Performance Killer
Unlike memory, exceeding a CPU limit does not kill the pod. Instead, the Linux kernel throttles it — forces it to wait. This appears as slow response times that are very hard to diagnose without knowing what to look for.
# Check if a pod is being CPU throttledkubectl exec -it order-api-7d9f8b-xkp2q -n production -- sh # Inside the pod — check the CPU statscat /sys/fs/cgroup/cpu/cpu.stat # Output to look for:# nr_periods 1250 <- total CPU scheduling periods# nr_throttled 380 <- periods where the pod was throttled# throttled_time 8500000 <- nanoseconds spent throttled # If nr_throttled / nr_periods > 10%, the CPU limit is too low# In this example: 380 / 1250 = 30% throttled — the limit needs to be raised# Fix: raise the CPU limit or increase replicas via HPA# If throttled 30%, raise limit by at least 50%containers: - name: order-api resources: requests: cpu: "200m" limits: cpu: "1500m" # Raised from 1000m to reduce throttlingStep 5: Setting a LimitRange to Protect the Namespace
# limitrange.yaml — auto-inject defaults for pods that have no resources setapiVersion: v1kind: LimitRangemetadata: name: production-defaults namespace: productionspec: limits: - type: Container default: cpu: "500m" memory: "512Mi" defaultRequest: cpu: "100m" memory: "128Mi" max: cpu: "4" memory: "8Gi" min: cpu: "50m" memory: "64Mi"Production Best Practices & Common Pitfalls
- Set memory limit to at least 30% above what you observe at peak. A container that consistently runs at 90% of its memory limit will OOMKill on any traffic spike or GC pause.
- For Java applications always set
-XX:MaxRAMPercentage=75.0as a JVM flag. Without this, the JVM sets its heap to 25% of total node RAM — completely ignoring the container memory limit — and gets OOMKilled. - For Node.js applications always set
NODE_OPTIONS=--max-old-space-size=<MB>to 75-80% of your memory limit. Node.js will not GC aggressively enough without this and will exceed the limit.
COMMON MISTAKE / WARNING**Common Mistake:** Setting `requests` equal to `limits` on every pod to get Guaranteed QoS without measuring actual usage first. If you set both to 2 CPU and the pod only uses 200m normally, you are wasting 1.8 CPU worth of reservation on every node. This leads to a cluster that looks full but is actually 90% idle — you cannot schedule new pods because reserved capacity is blocking them.
Quick Reference & Troubleshooting Commands
| Command | Purpose |
|---|---|
kubectl top pods -n <ns> |
See live CPU and memory usage per pod |
kubectl top pods --sort-by=memory -n <ns> |
Find the highest memory consumers |
kubectl get pod <name> -o jsonpath='{.status.qosClass}' |
Check QoS class of a pod |
kubectl describe node <node> |
See allocated vs total resources per node |
kubectl describe limitrange -n <ns> |
View the active default resource policy |
kubectl describe quota -n <ns> |
View namespace resource quota usage |